Using Polar Plots for Web-based Graphics
by R. Glass
Y2M 10/24/03
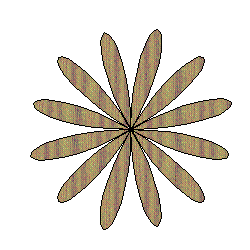
Man (and of course women) first studied mathematics in order explain and reproduce the world around them. What is the graph of a flower? Such a graph in rectangular xy coordinates would be complicated to plot, yet nature produces flowers along similar symmetrical and asymmetrical shapes readily.
By making use of a particular coordinate system and functions called polar graphing, a graphical mathematics software package, and a painting program to add color and texture to plots generated, one can create original, custom and often beautiful web-based graphics.
The tools used to create the graphics over the years varied from inexpensive painting programs such as PC-Paintbrush Designer (a few dollars on one of those cheap CD- Rom racks) to high-end, expensive program such as Adobe Photoshop©.
Creating the Graph.
The first thing needed is a program that will allow you to create mathematical graphs.The program I used to create the mathematical graphs you see within this talk is a program called Maple©. Information on Maple© can be found at http://www.maplesoft.com. This program does far more than just create graphs. It is a high-end mathematical software package that can used for numerical, symbolic and graphical applications of mathematics for teaching, learning and research. The basic functionality needed for creating the web-graphics is the ability to either copy and paste to another program the graph or save it as a common graphic file type. A quick search on your favorite search engine may in fact turn up some simple and free (or at least trial versions) of programs that would you to accomplish this.
Modifying the Graph.
You will need a prgram that would allow you modify graphs. One such program every Windows system has is Paint. Although, the best, it will do the job. Unfortunately, Paint (at least the version I have) will not generate the neccessary file format for the web. Web graphics need to be either GIF (Graphic Interchange Format) (PC extension: .GIF) or JPEG (Joint Photographic Experts Groug). When using Paint, you will need a program to convert the Paint file (BMP or PCX) file to GIF or JPEG. One such program is LView http://www.lview.com. See also http://www.matcmp.sunynassau.edu/~glassr/html/graphics.htm for additional information on web-based graphics.Today, there may already be programs on your systems that would allow you to modify graphics. Be sure to check out any software that came with your digital camera or scanner. These are often scaled down versions of high-end graphics programs.
Graphics Program
The minimal features of your graphics program should be to:- Paint or color regions of a graph. This is usually denoted by a paint bucket.
- Add text to a picture. Usually denoted by the letter A or T.
- Gradient fill. This is where the software will create a range of colors between two endpoint colors.
- Add texture which is usually accomplished by adding noise.
- Creating a drop-down shadow for a three dimensional effect. You can also create drop-down shadow effect by pasting your graph over a light gray version of the original graph offset slightly.
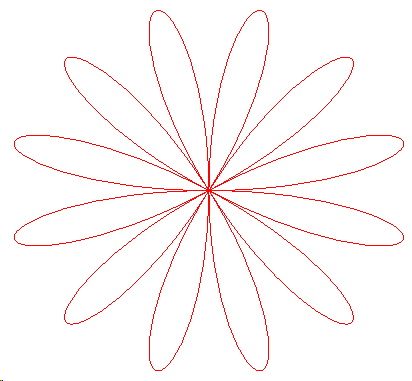
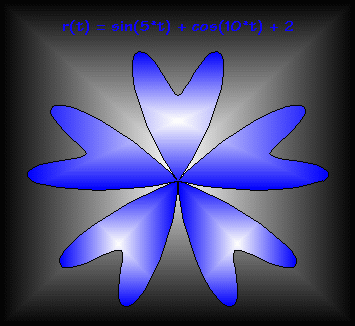
Samples
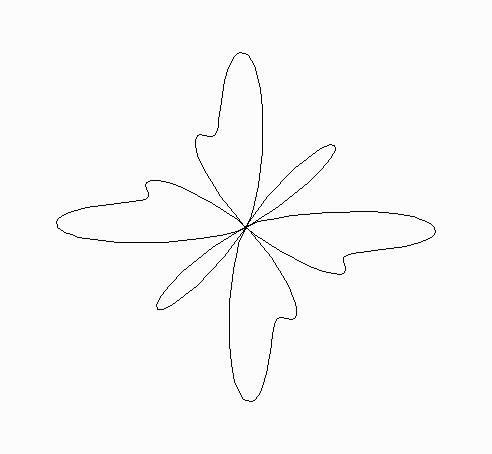
Butterfly
r = 1+2cos3(4t) + - sin(2t)
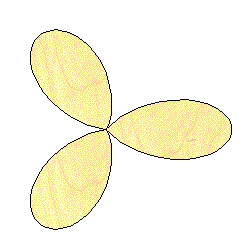
Mittens
r = 1 + sin(4t) + sin(2t)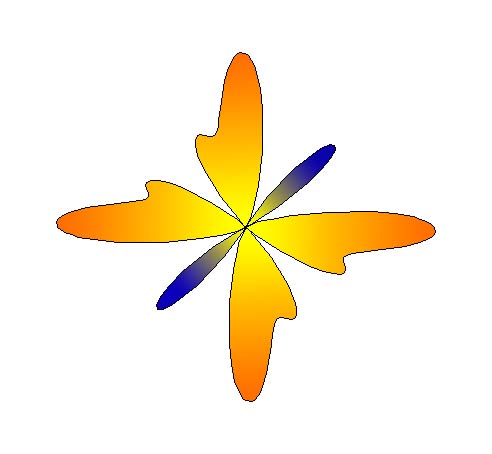


 , one can obtain a seemless image.
The idea presented above was applied to a back image. This page once served as one of the department webpages

Other than using Maple, I completely forgot how I made this.